C-10 Creates New Data Analytics Tool for Radiation Monitoring Network
- By C-10 Team
- •
- 22 Sep, 2022
Improving our ability to track radiation clouds in real-time during an emergency, and endless opportunity for use in scientific and health-impact research.

C-10 is on board with the data revolution! For over 30 years our Citizens Radiation Monitoring Network (CRMN) has been collecting data on the airborne radiation levels in the 10-mile Emergency Planning Zone (EPZ) radius around the Seabrook Nuclear power plant.
Since 2010, all that data has been digital, empowering us to make our data usable for not just our own research, but also potentially useful in the areas of health-impact studies, regulatory compliance, radiation physics, and more!
The C-10 CRMN measures and records the following at each of our 19 stations, for every minute of every day:
- Wind speed & direction using an anemometer
- Beta radiation levels using a radiation probe
- Gamma radiation levels using a radiation probe
That’s over 1,440 data points each totaling 4,320 data points per station per day, meaning we record over 80,000 data points across the whole network every day!
You might be thinking, whoa, that’s a lot of data, and you’re right. Ever try to load an Excel Spreadsheet with more than a few hundred rows? Then you know that trying to analyze a large set of data in a simple software application is impossible, unless you perhaps have IBM’s artificial intelligence supercomputer Watson.
For the scientists and data enthusiasts out there:
Our process for analyzing and reporting our monitor data is very time-intensive, requiring mass downloading of the log files for the month, loading them into Matlab, and producing the series of charts and analyses which are printed to a PDF format for easy transmission and readability by the Massachusetts Department of Health and other key investigators.
For the layperson: A PDF is a nice “at a glance” review, but is not user friendly for in-depth analysis and research. Understanding the untapped benefits of being able to look at large amounts of our historical data for public health, transparency, and scientific research, we embarked on a journey to find people with the right skills to help us.
The Inquiry
C-10 inquires with Pro Bono Analytics (PBA), who serves as a conduit for groups like C-10 to find skilled people willing to donate their time for free.
C-10 submitted a Request for Proposal to make our database queryable and improve our ability to analyze the data from our monitoring stations. To our shock and delight we had over a dozen applicants! After careful consideration, two stood out above the rest and we selected Alva Dillon and Phil Fry to partner with us on this project. We are grateful that they generously donated their time and expertise.
The Approach
After weeks of collaborative sessions with the PBA team and Mike Mansir, we elected to consolidate the data into files that each holds three months’ worth of data for a single radiation monitoring site.
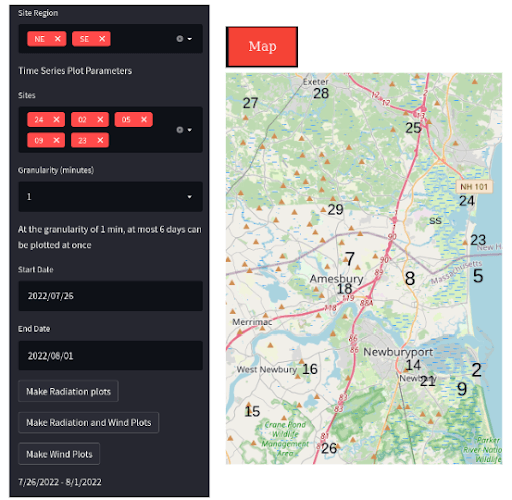
The team built an application that charts the sensor data and allows the user to interact with the chart to focus on areas of interest. A user can make any number of selections on which monitoring sites to review: all sites across the network, focus on a single or multiple regions, just a single site, etc. Our control site, located in Somerville, MA, is also available and provides valuable baseline reference, and validates that the normal background radiation level in our region is higher than 40 miles further away from the plant.
The C-10 Radiation Data Illustrator was created using an interactive application using the Streamlit framework for Python applications. The application allows interested parties to access the data over the web and plot the radiation time series and related wind plots over the desired time frame.
The Results
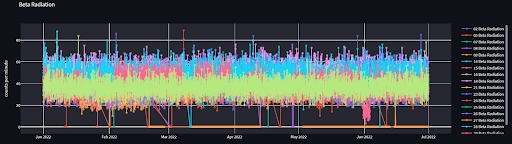
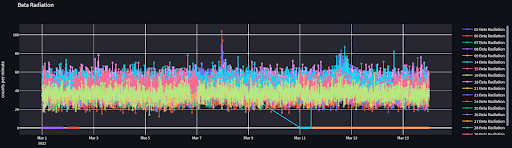
The radiation levels are shown as line charts, and wind speed and direction for the same time period are shown as radial scatterplots.
The combination of charts allows interested parties to identify spikes and other anomalies in the radiation levels, and if desired a user can see where those correlate with wind speed and direction.
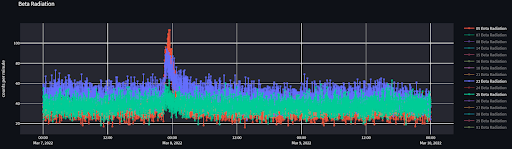
The investigator can narrow in on time frames of interest and can focus the analysis down to individual monitoring stations. At the finest level of detail, the investigator has access to the minute-by-minute readings of both radiation levels and wind conditions from the stations.
In the following example, you can see how a user would visually be able to notice an unusual reading, and zoom in to get more detail:
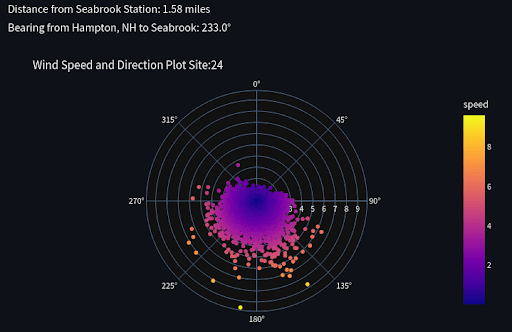
Here is an example of how a user may view the wind speed and direction data from a site over a period of time. This can help inform where radiation came from and to where it traveled next. In a real radiological emergency, this information could be accessed in real time and would be crucial to help inform officials where it is safe to send evacuees, something that Japanese officials did not know during the Fukushima accident when they inadvertently sent citizens directly into areas of high radiation.
For Longevity, the team also built file maintenance support into the application so that the application can take in the new data on a regular basis and add it to the existing stockpile of data to keep it fresh and up-to-date. What the PBA team and C-10’s Mike Mansir have built is a more modern analytics platform to give the interested parties more interactive access to the data.
Jaw Dropping Reactions: The C-10 Board of Directors, many of whom serve on our Research Team, were amazed at the finished product.
Our dedicated research-minded members have often marked on their calendars when they were aware of something going on at or near the plant, and would ask for a summary CRMN readings - a request that used to take time and effort to fulfill. Now, we can research those incidents immediately, or years from now! Some examples might include:
- July 12, 2022: false evacuation alarm at Seabrook nuclear plant; a review of the data confirms that there were no abnormal readings network-wide
- 9/15-9/28 2021: there was fan failure on one of the three tower cooling fans which left it inoperable 9/17/21-9/26/21; a review of the data confirms there were no sustained high readings of any radiation
- November 2019 (Thanksgiving, specifically 11/28/19): Buffalo, NY, coal plant incident brought gamma radiation to our region causing some spikes in our readings; thorough investigation at the time was very timely and ultimately absolved the nuclear plant of involvement in the release, a process that will be shorter with this new illustrative tool
- Comparing our readings to New Hampshire’s thermoluminescent dosimeter (TLD) film data, comparing to the plant’s data, validating that they align and investigating where they do not
The Board’s reactions were akin to a kid at Christmas, and our team is thrilled to be using this tool for our own research, but are also offering it as a tool for academic and public health research.
What Does the Future Hold?
C-10 Researchers will get to work bolstering their methods with this sophisticated tool, reducing research timeframes astronomically. They have the ability to remotely access this tool from any computer.
C-10 member donors or the public are welcome to request a visit to our office to use our dedicated guest portal and use this tool.
Projects and grant opportunities will be considered, if C-10 can help provide information to support radiation health impact studies, or other scientific endeavors.
Don’t worry, we will keep you all updated if anything important and interesting is discovered through the use of this new C-10 Radiation Data Analysis Tool.
Meet the Pro Bono Analytics Team

Alva Dillon is a Ph.D. student at Brandeis University studying plasmons and excited state dynamics using computational chemistry. Through his academic training he’s gained experience in creating computational workflows, automating computational tasks, and data analysis. Alva thoroughly enjoys learning to use computational tools to expand on his experiences and to create something new. When he’s away from his computer Alva enjoys rollerblading, hiking, and spending time with loved ones. Connect with Alva on linkedIn!
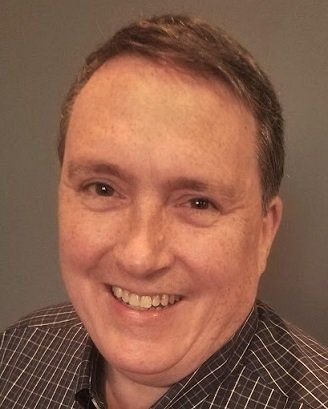
Phil Fry is an experienced IT and business management consultant currently working as a solo practitioner. He began his career as a consultant and an instructor with Oracle Corporation. Later he worked with Diamond Technology Partners (now part of PwC) helping clients shape and execute their IT strategy. More recently, he joined Slalom where he focused on developing his clients’ advanced analytics capabilities. Phil has a Bachelor’s degree in mathematics from Harvard, and an MBA from the University of Chicago Booth School of Business. Phil can be reached by email atpfryanalytics@gmail.com or on linkedIn!
Follow us